
Buckets
What are Buckets?
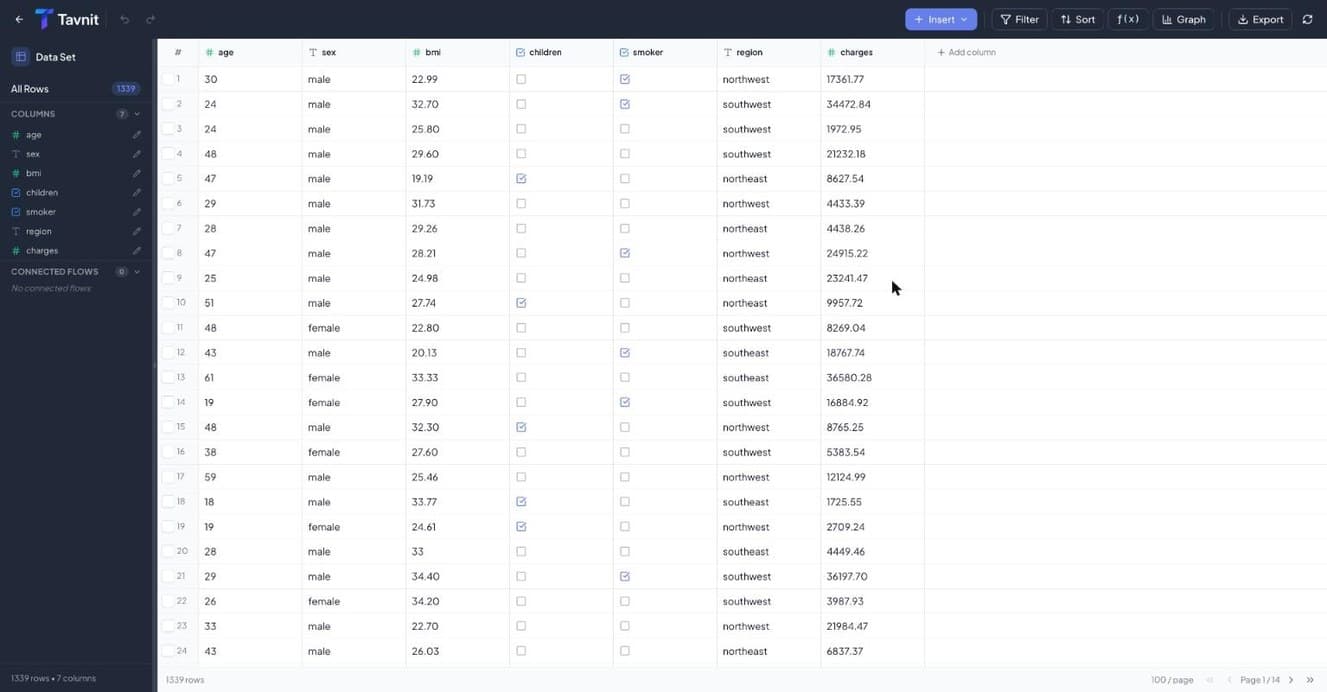
A Bucket is a structured table that lives inside Tavnit. Flows write their extracted rows into it automatically, you can append to it over the API or from a CSV, and you can filter, sort, compute and chart the result without exporting it anywhere.
A flow run stores the result of one document. A Bucket is where results accumulate across every run, so the question changes from “what did this invoice say?” to “what have we been billed this quarter?”. Every row has to match the Bucket's columns, which is what keeps that aggregate meaningful.
You can link flows to buckets so that extracted data is automatically written into the bucket after each document is processed. This lets you aggregate results from multiple runs into one place.
When to Use Buckets
Buckets are ideal for:
- Aggregating extraction results from multiple flow runs into a single table
- Building datasets that combine document data with external sources
- Syncing data from external systems via the API
- Creating a central data store that multiple flows write into
Flow runs store individual document results. Buckets aggregate data across runs and external sources into a unified table you can export or query.
Creating a Bucket
Follow these steps to create a bucket:
- 1Go to the Buckets page from the main navigation
- 2Click "New Bucket" and give it a name
- 3Define the columns (name and data type for each)
- 4Optionally link flows that should write data into this bucket
- 5Save your bucket
When using the API, every row you send must have exactly the same column names as your bucket. Choose clear, consistent names upfront.
Finding Your Bucket ID & Name
To use the Buckets API, you need your bucket's ID and name. Both are available in the bucket info dialog:
- 1Go to the Buckets page
- 2Tap the info icon on the bucket you want to use
- 3Copy the Bucket ID and Bucket Name (both are copyable with a single tap)
The API requires both bucket_id and bucket_name to prevent accidental writes to the wrong bucket. If the name doesn't match the ID, the request is rejected.
Four ways data gets in
Nothing about a Bucket assumes the data came from a document. Flow exports, Cleaner actions, agents, the API and CSV import all write into the same table, which is what makes a Bucket useful as reference data as well as a destination.
| Source | How it works | Typical use |
|---|---|---|
| Bucket export on a flow | Each completed run appends its rows, with extracted fields mapped onto Bucket columns. | Accumulating every invoice you process into one table. |
| A Cleaner action | A conditional action writes a value back into an existing Bucket row that a Lookup matched. | Marking an order received, or decrementing a stock count. |
| An agent | One row per agent run, with captures mapped onto columns. | Recording live supplier prices fetched from a portal. |
| The REST API or a CSV import | Append rows directly, by request or by upload. | Loading a price list or customer catalogue to look values up against. |
A Bucket is not only a destination. Cleaner Lookup fields pull values out of one to enrich a row, and Bucket Check fields ask whether a row already exists — which is how de-duplication works. Load your catalogue into a Bucket and every flow can match against it.
If a Cleaner reshapes rows into wide format for delivery, the Bucket still receives the original long-format rows. Stored data keeps one row per record so aggregates and lookups stay correct.
Working with the data
The grid is closer to a spreadsheet than a read-only report. You can edit in place, filter and sort, add computed columns, and page through large tables — a Bucket with thousands of rows stays usable in the browser.
| Control | What it does |
|---|---|
| Insert | Add rows or columns to the table. |
| Filter | Narrow the view to rows matching conditions you set. |
| Sort | Order by one or more columns. |
f(x) | Add a computed column derived from the others. |
| Graph | Chart the data in place — see below. |
| Export | Download the current rows as CSV. |
| Undo / redo | Step back through edits made in the grid. |
Each column carries a type — text, number, date or boolean — shown beside its name. Types are what let sorting, aggregation and charts behave correctly, so a numeric column that arrived as text is worth fixing at the source rather than in the grid.
Access Control
Every bucket has a visibility setting and supports per-member access grants, so you can control exactly who can see or edit your data.
All members of your organisation can view the bucket. Admins and owners can always edit it.
Only users who have been explicitly granted access can see or edit this bucket. Only admins and owners can make a bucket private.
Member-level grants (for private buckets or fine-grained control):
- View — can open the bucket and read its data
- Edit — can add, update, and delete rows
- Admin — can change columns, visibility, and manage other members' access
Charts
You can create charts directly from bucket data to visualise trends and aggregations without exporting to another tool.
Bar, Line, Pie, and Scatter charts are available. Each chart is saved with the bucket and visible to anyone who can access it.
Creating a chart:
- 1Open the bucket's detail page
- 2Click "Add Chart" in the charts section
- 3Choose chart type and select x-axis and y-axis fields
- 4For bar and line charts, choose an aggregation (sum, average, count)
- 5Save — the chart appears immediately and updates with new data
CSV Import & Export
Buckets support importing data from CSV files and exporting all rows to CSV.
Upload a CSV file and Tavnit will map its columns to your bucket's columns. Column names in the CSV must match the bucket's column names exactly.
Download all current rows as a CSV file from the bucket's detail page. Useful for sending data to other tools or creating offline backups.
Both import and export are available from the toolbar at the top of the bucket's data table.